 Indonesia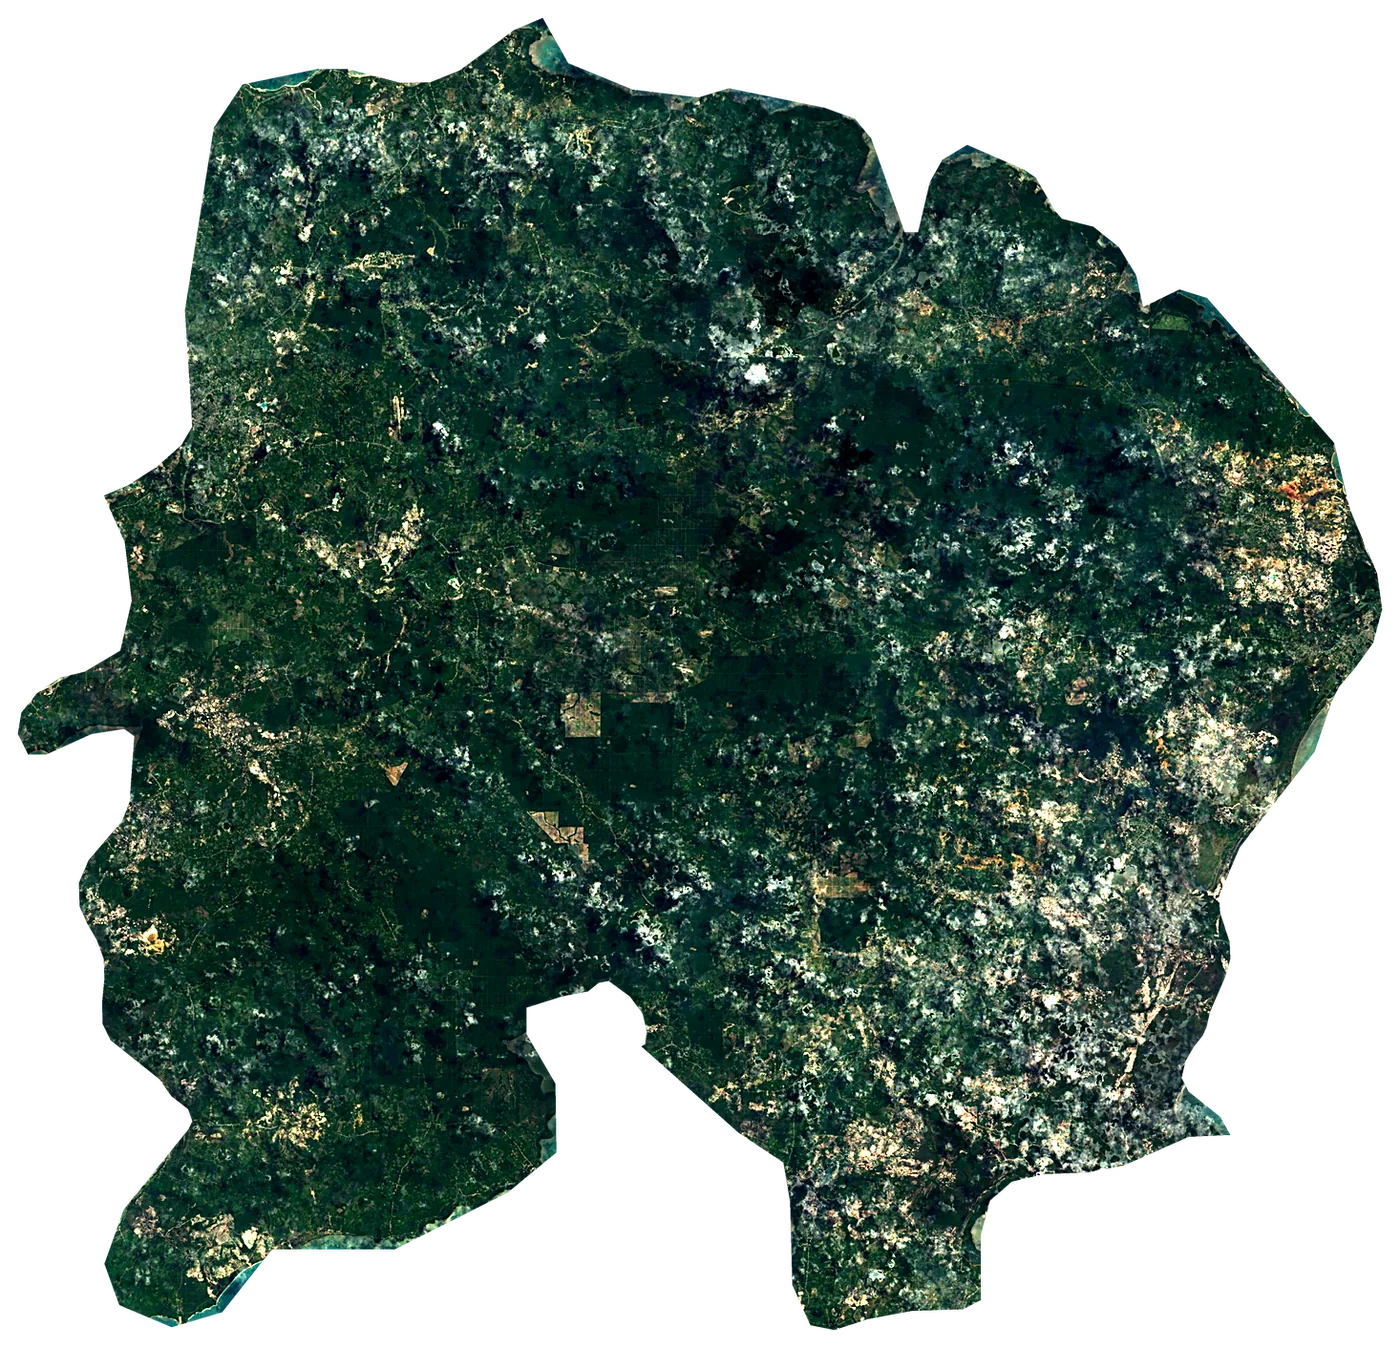
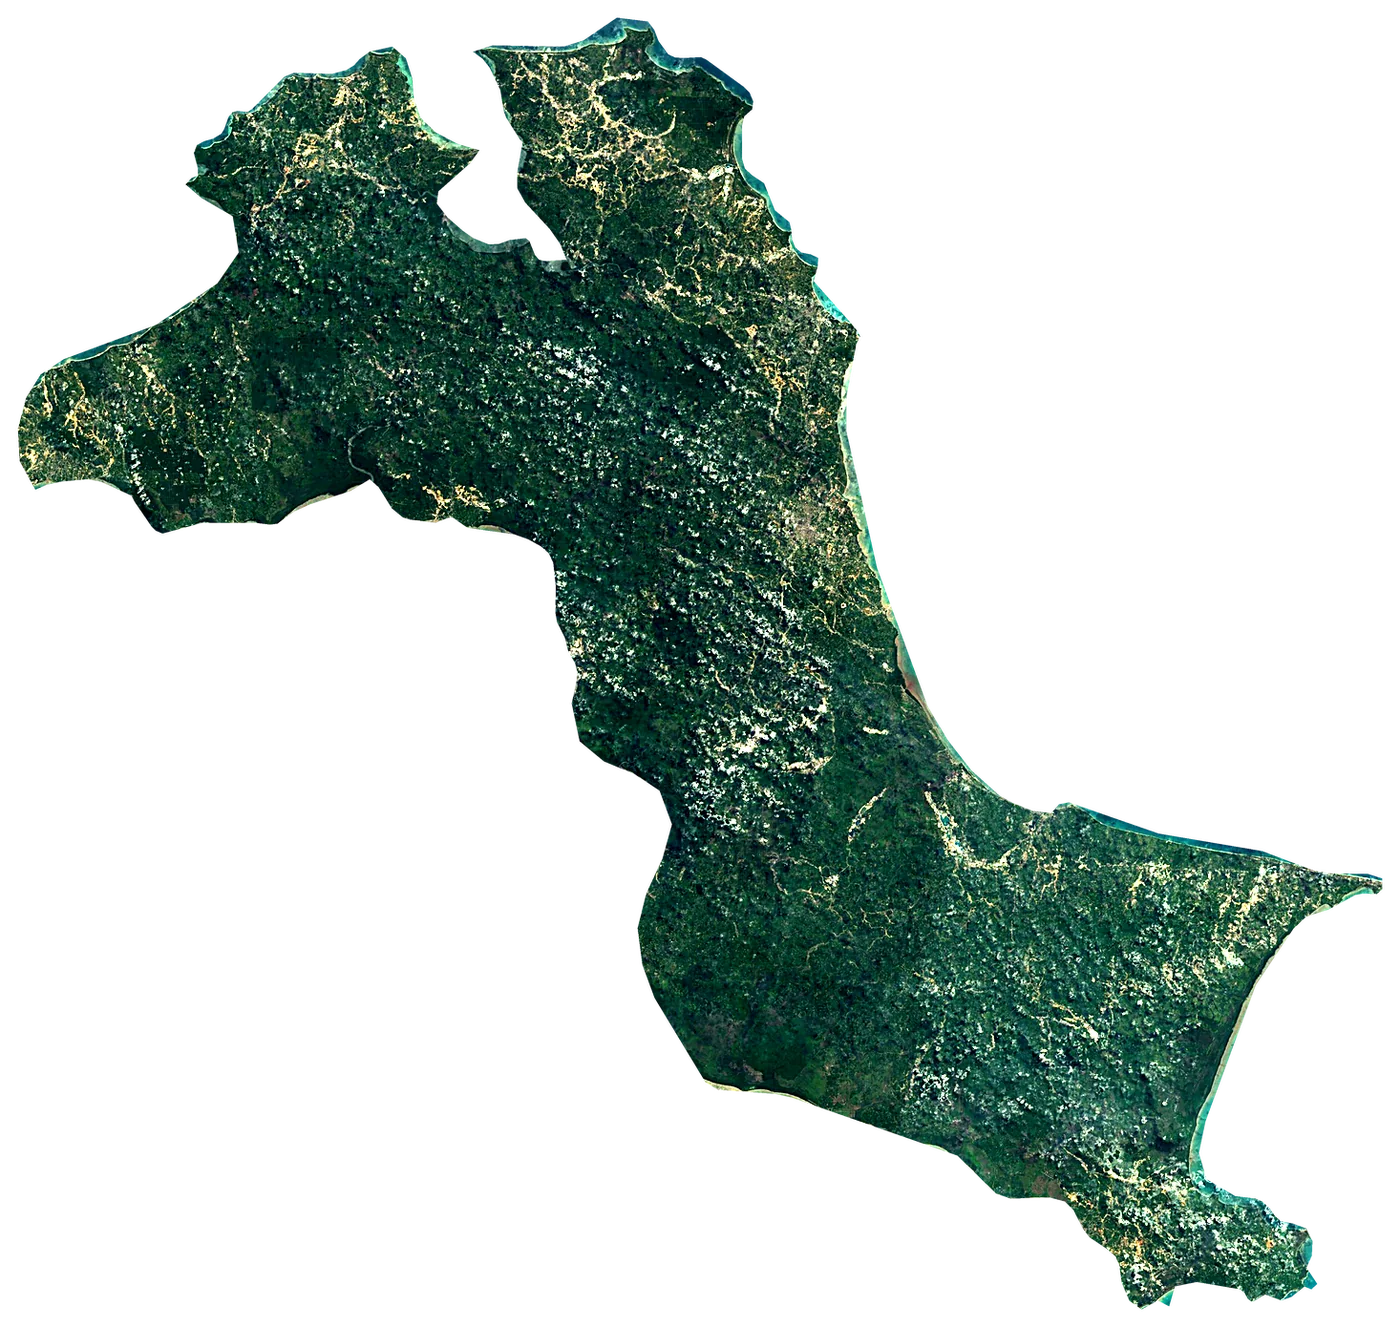
Satellite: Sentinel-2 cloudless 2016 by EOX (CC BY 4.0). Outline and points © OpenStreetMap contributors / Natural Earth. North up.
In numbers
4,478km²
Area
333km
Coastline
measured on a simplified outline
34m
Highest point
160,000
People
30°C
Warmest sea
May
563km
To the mainland
When to go to Belitung Island
Best for the beach from January to April and in August.
The sea is warmest in May (30 °C) and coolest in February (28 °C). You can swim comfortably all year (21 °C or more).
Averages 1991–2020. Sea: NOAA OISST, the water within 35 km of the coast. Air, rain and sun: NASA POWER. Best months weigh warm afternoons (23–30 °C), sea of 24 °C or more and few wet days.
Island in Bangka Belitung Islands Province, Indonesia
Belitung Island is an island in Indonesia. It covers 4,478 km², with 333 km of coastline. Its highest point rises to 34 m. About 160,000 people live on it. The nearest mainland is 563 km away.
Getting there
- Depati Amir Airport (PGK)nearest airport with scheduled flights · 212 km in a straight lineCar hire at CGK airport (Jakarta)Discover Cars · Affiliate link↗
- FerriesKetapang-Manggar, Manggar-Sadai
- 563 km from the mainlanddistance to the nearest continental coast
- From January to April and Augustbest months to go (from 30 years of averages)
Plan the trip
Ferries, stays and things to do
Some links above are affiliate links: if you book through them we may earn a commission, at no extra cost to you. It never changes what the data on this page says.
On the island
What you find on Belitung Island.
- 4beachesTanjung Tinggi Beach and 3 more
- 3ferry terminalsManggar
- 8named peaksPudak, Gunung Klapakampit, Gunung Bolong and 5 more
- 1waterfallsAir Terjun Bidadari
- 1campsites
- 12hotels, guesthouses and apartments
- 16restaurants, cafés and bars
Counted in OpenStreetMap, the map anyone can edit, inside the island's outline. A low number may only mean nobody has mapped it yet.
The shape of the land.
On average the island stands 29 m above the sea. 99 % of it is below 200 m.
- 90 %0–50 m
- 9 %50–200 m
- <1 %200–500 m
Share of the island's area in each altitude band, from the Copernicus DEM (30 m, read at 30–240 m on large islands).
Size, for real
Next to islands you may know.
100 km
All outlines drawn to the same scale (Natural Earth and OpenStreetMap).
Towns on the island
- Manggar39,135 people
Month by month
The weather on the island.
| Jan | Feb | Mar | Apr | May | Jun | Jul | Aug | Sep | Oct | Nov | Dec | |
|---|---|---|---|---|---|---|---|---|---|---|---|---|
| Afternoon high (°C) | 28 | 28 | 29 | 29 | 29 | 29 | 28 | 29 | 29 | 29 | 29 | 28 |
| Night low (°C) | 26 | 26 | 27 | 27 | 28 | 27 | 27 | 26 | 26 | 27 | 27 | 26 |
| Sea (°C) | 28 | 28 | 29 | 30 | 30 | 30 | 29 | 28 | 29 | 29 | 29 | 29 |
| Rain (mm) | 253 | 172 | 195 | 264 | 234 | 181 | 133 | 83 | 110 | 213 | 333 | 374 |
| Wet days | 29 | 24 | 28 | 29 | 27 | 22 | 18 | 14 | 15 | 24 | 29 | 31 |
| Sun h/day | 4.9 | 5.8 | 6.1 | 5.8 | 6.1 | 6.5 | 6.9 | 7.2 | 6.4 | 5.1 | 4.4 | 3.6 |
| Wind (km/h) | 17 | 16 | 11 | 9 | 13 | 16 | 19 | 21 | 19 | 13 | 10 | 14 |
Averages 1991–2020 for the ~55 km NASA POWER cell over the island; the sea from NOAA OISST.
Recent years
Warmer and cooler years at sea.
Each month's sea temperature compared with its 1991–2020 average, in degrees.
| Jan | Feb | Mar | Apr | May | Jun | Jul | Aug | Sep | Oct | Nov | Dec | |
|---|---|---|---|---|---|---|---|---|---|---|---|---|
| 2020 | +0.4 | +0.7 | +0.8 | +0.3 | ±0.0 | +0.2 | +0.2 | +0.6 | +0.3 | ±0.0 | −0.2 | +0.1 |
| 2021 | −0.1 | −0.5 | −0.1 | ±0.0 | +0.3 | +0.4 | +0.4 | +0.3 | +0.4 | +0.6 | +0.3 | +0.4 |
| 2022 | +0.4 | +0.3 | +0.6 | +0.6 | +0.6 | +0.4 | +0.5 | +0.6 | +0.3 | +0.1 | −0.1 | −0.1 |
| 2023 | −0.1 | ±0.0 | −0.6 | −0.4 | +0.2 | +0.1 | +0.3 | +0.2 | +0.2 | +0.4 | +1.2 | +1.0 |
| 2024 | +0.8 | +0.7 | +0.3 | +0.9 | +0.4 | +0.7 | +0.7 | +0.5 | +0.6 | +0.9 | +1.1 | +0.7 |
| 2025 | +0.3 | +0.2 | +0.1 | −0.3 | +0.4 | +0.4 | +0.3 | +0.3 | +0.3 | +0.5 | +0.1 | +0.3 |
+1 warmer than usual −1 cooler than usual
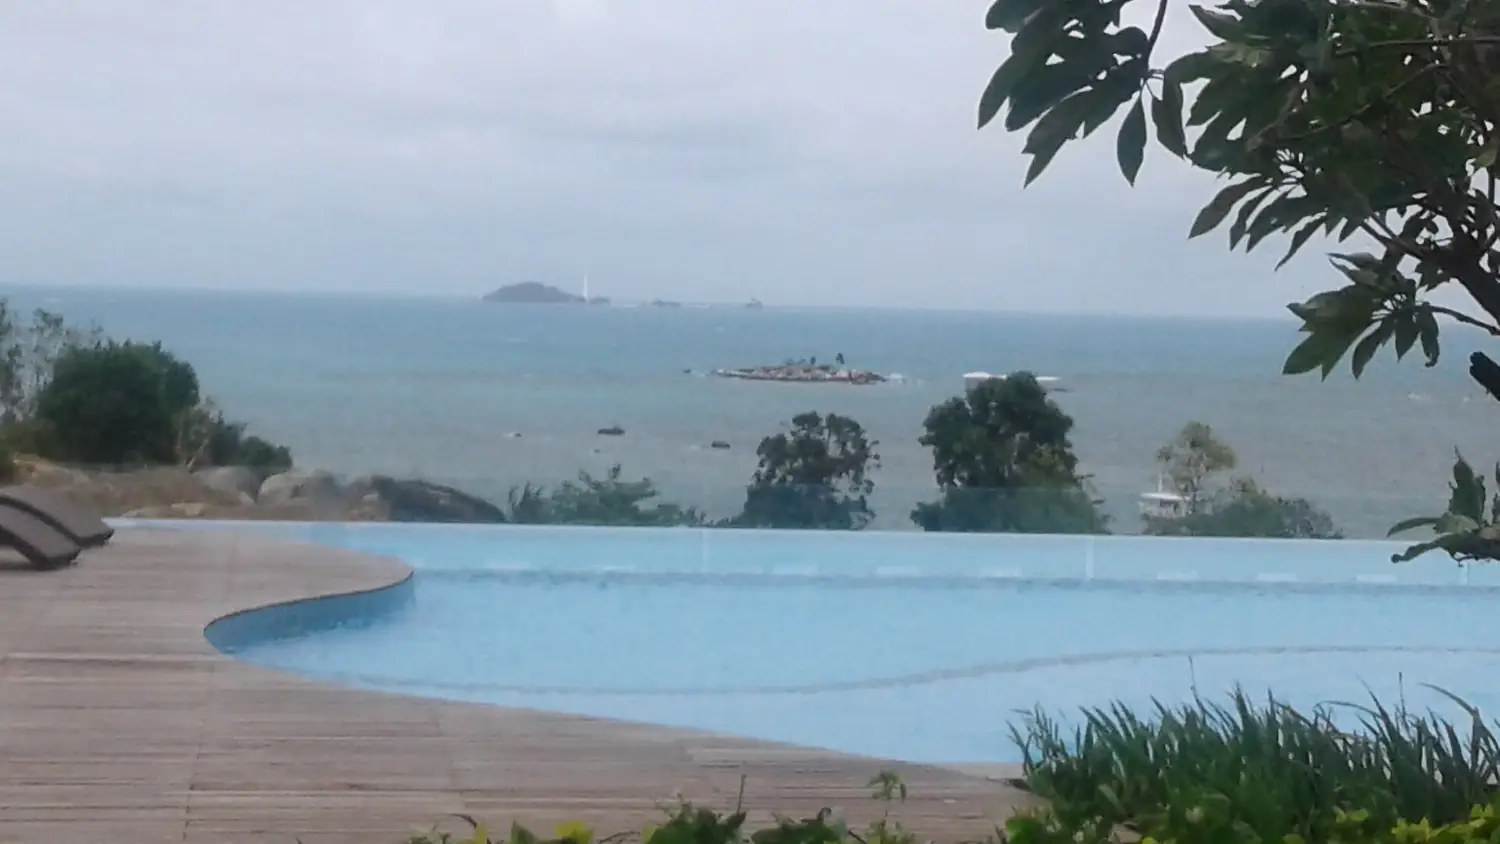
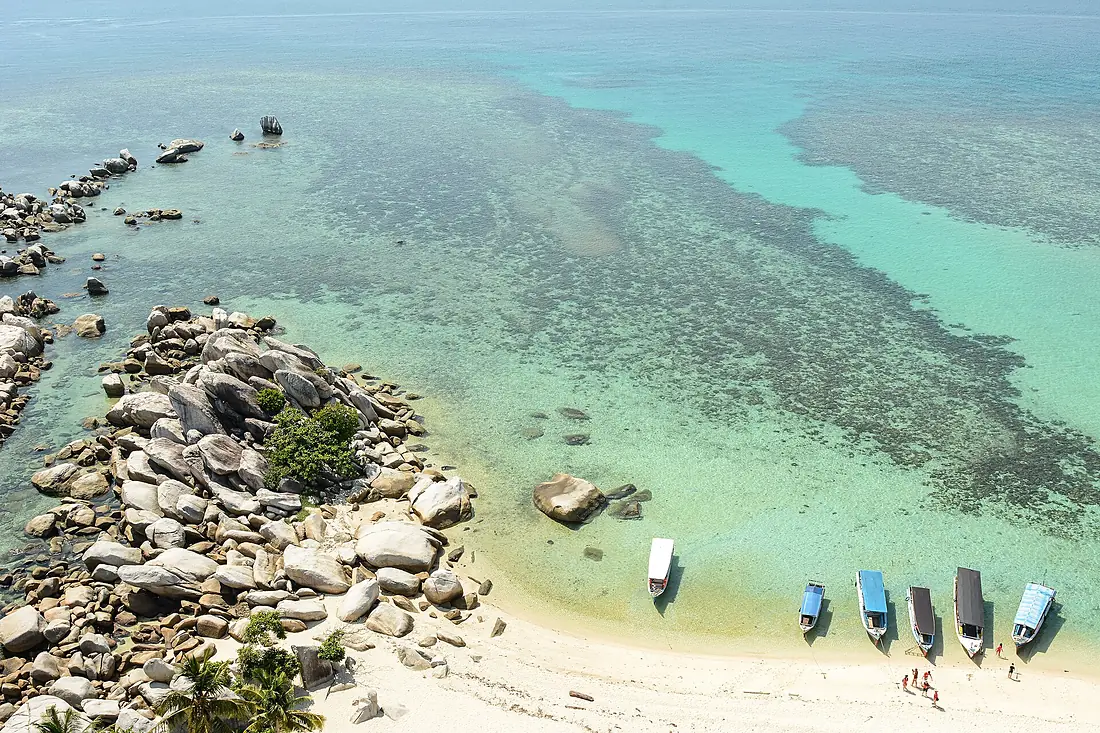
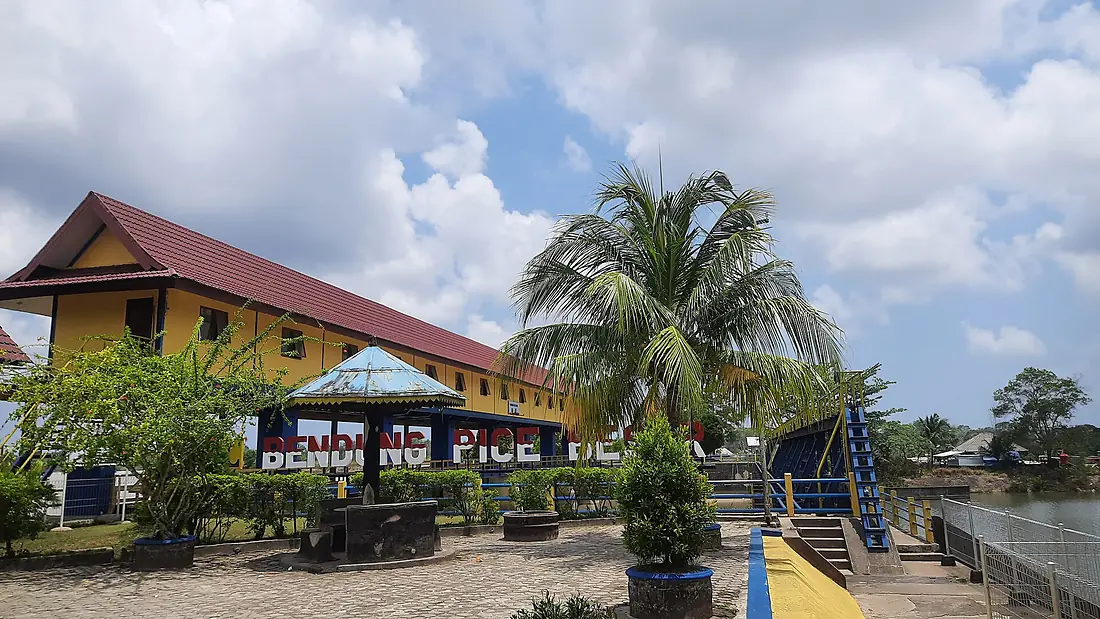
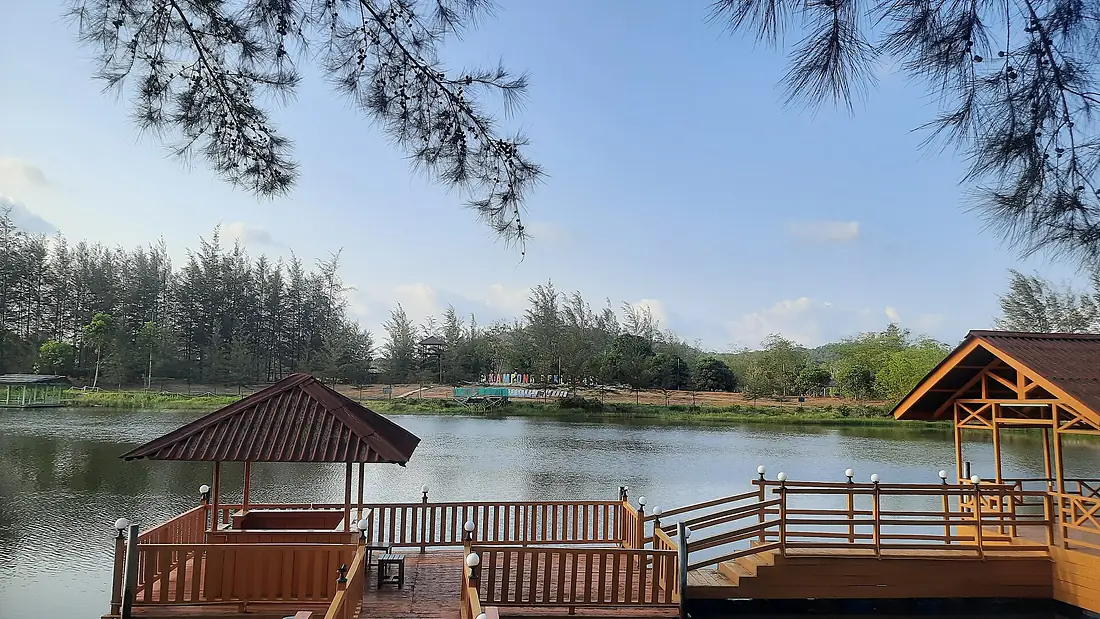
Photos
Seen by visitors.
Nearby
More islands nearby.
About these numbers
| Names, area, population | Wikidata (Q334771) · CC0 |
|---|---|
| Outline | Natural Earth · public domain |
| Sea temperature | NOAA OISST v2.1 · 1991–2020 |
| Climate | NASA POWER · 1991–2020 |
| Relief, 3D model | Copernicus DEM GLO-30 · © DLR e.V., © Airbus Defence and Space GmbH, Copernicus/ESA |
| Beaches, ports, lighthouses, trails | © OpenStreetMap contributors · ODbL |
| Towns | GeoNames · CC BY 4.0 |
| Images | EOX Sentinel-2 cloudless 2016 · CC BY 4.0; Wikimedia Commons |
Every figure is an average, an estimate or a count from a public dataset. Licences and methods: data sources.
The family
Do you prefer beaches, lakes, mountains, waterfalls, islands, rivers or canyons?
Same idea, other landscapes: field atlases built on open data, month by month, in seven languages.
 beaches
 Find your beach: sea temperature, sun and swimming month by month.Visit
  lakes
lakes Every lake on Earth: water temperature, ice, depth and the shore.Coming soonVisit
  mountains
 Every summit in 3D: summit weather, the 0 °C line, huts and trails.Visit
  waterfalls
 Every waterfall: height, flow month by month and when it roars.Coming soonVisit
  islands
 Every island from the sea up: size, sea temperature, ferries and 3D.You are here
 rivers
 Every river from source to sea: the journey, the flow and the basin in numbers.Visit
  canyons
 Every canyon cut to scale: depth to the floor, rim and floor temperatures, trails and viewpoints.Coming soonVisit